Set the remote debugger configuration in Eclipse, to debug the running application code and identify the code issues.
Step 1: Open the Debug perspective from tool bar. if you don't see debug perspective option in your toolbar, then open the perspective from this path in Eclipse.
Windows >> Perspective >> Open perspective >> Others >> Debug
- Click on the perspective drop-down option very next to bug symbol.
- Select the option Debug configuration
 |
| Debug Configuration in Eclipse |
Step 2: Debug Configuration will open a new window(below is the screenshot).
- Click on Remote Java Application option from left side rail.
- Click on the New Launch configuration(new configuration) button. As shown in the screenshot below.
 |
| Remote Java Application setup |
Step 3: Once you click on new configuration button, a configuration setup option will appear right side on same window. Switch to connect tab, if you are not on the connect tab by default.
- In Name section, please provide a valid name.
- In Connection Properties section specify the host and port on which your application is running.
e.g.
Host: localhost
Port: 30303 (default AEM debug mode port) - Project: Select the core folder of your project.
- Connection type: Keep it as Standard.
 |
| Debugger remote connection setup |
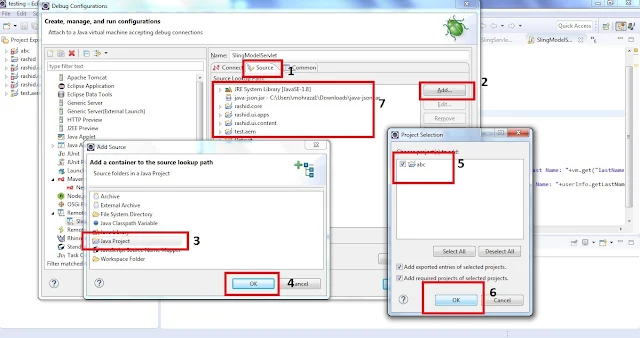
Step 4: Now switch to source tab, next to connect and configure your Java project. Below is the screenshot.
- Switch to source tab
- Click on Add option
- Select Java Project option
- Hit Ok button
- Select your project
- Hit Ok button
- After successful selection your project get added in the source section.
 |
| Debug project setup in Eclipse |
You have successfully setup the debugger with your remote application. Now run or tune your application in debug mode and start the debugger in Eclipse from debug perspective to listen the request from your application server to Eclipse.
No comments:
Post a Comment